


Where is the Bottom in Treasuries!!??
Where is the Bottom in Treasuries!!??

Hello investing friend!
I hope you are well! Got a big one for you!
First, I need your help please! Find this email in spam and move to your inbox, and please reply with a “hi” to the spam one. Thank you to the people that did this last week, please do again so I can make sure you get these! Thank you!
OK, let's go!
Where is the bottom in Treasuries!!??
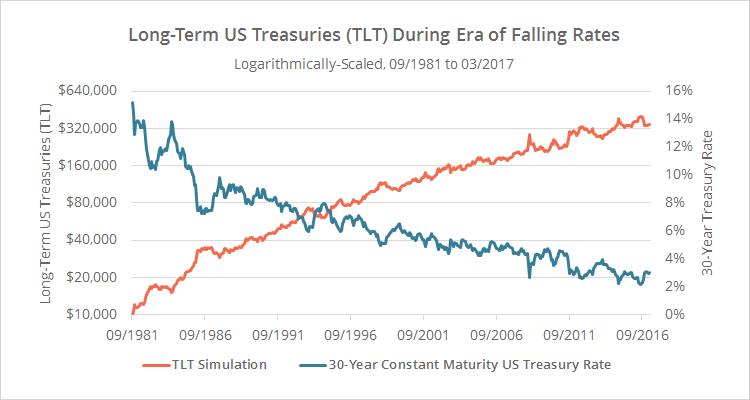
For baby boomers' entire investing lifetimes long term treasuries have faithfully served them, with nary a hiccup:
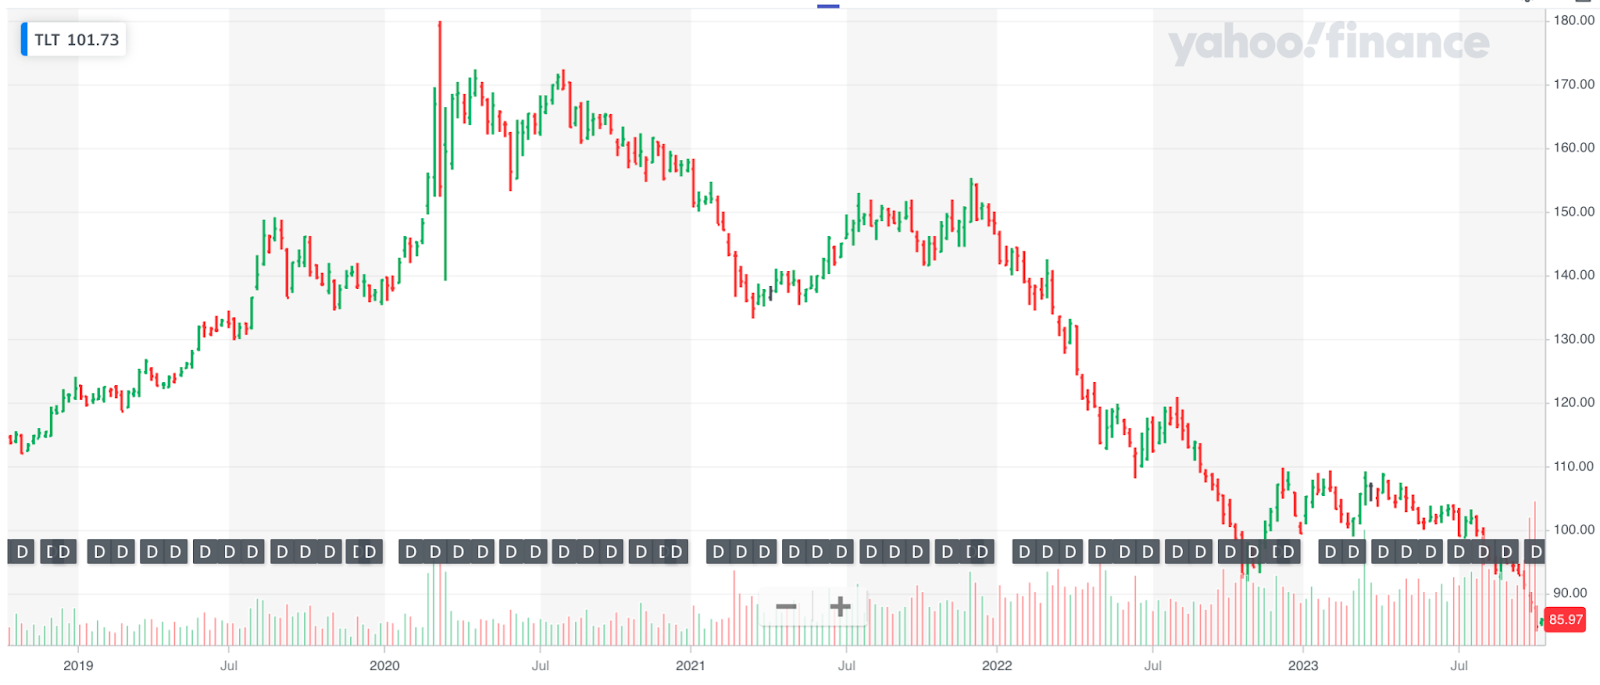
But now these bonds have been decimated, selling off more than 50% from the top (as seen in the popular $TLT fund). Many thought this simply impossible:
So is this the bottom? If not, how will we know when?
It does not look like the bottom is in yet. The 50 year old die-hard thesis of treasuries-will-treat-me-well is incredibly strong in investors and asset managers alike.
Thus, there has been significant “propping up” of this asset class from buyers that have been using the 50 year old gameplan, rather than assessing the market with fresh eyes.
As @biancoresearch astutely points out, market pundits are the most bullish they have been since COVID!
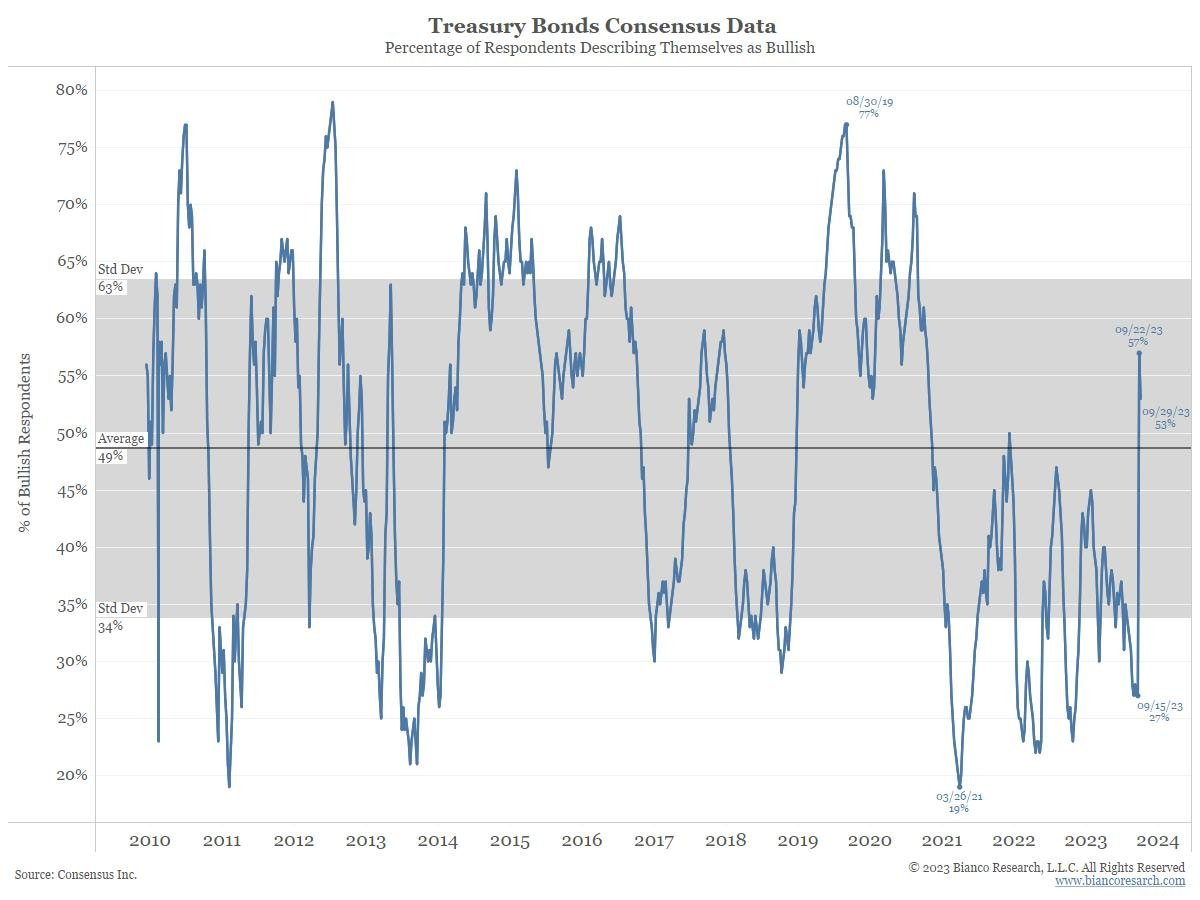
The mantra of automatic good times in treasuries is alive and well. There has been no capitulation, to say the least.
At some point traditional investors will acknowledge the new reality of huge deficits around the world, and the enormous and seemingly never-ending supply of high interest rate bonds that come with it.
So the event we are looking for is a sharp sell off in treasuries, a big move on volume, showing that the old guard has finally given up or run out of money.
At that point we can look at five factors to see if we are in fact at the bottom.
Come watch the show at 5 pm ET!
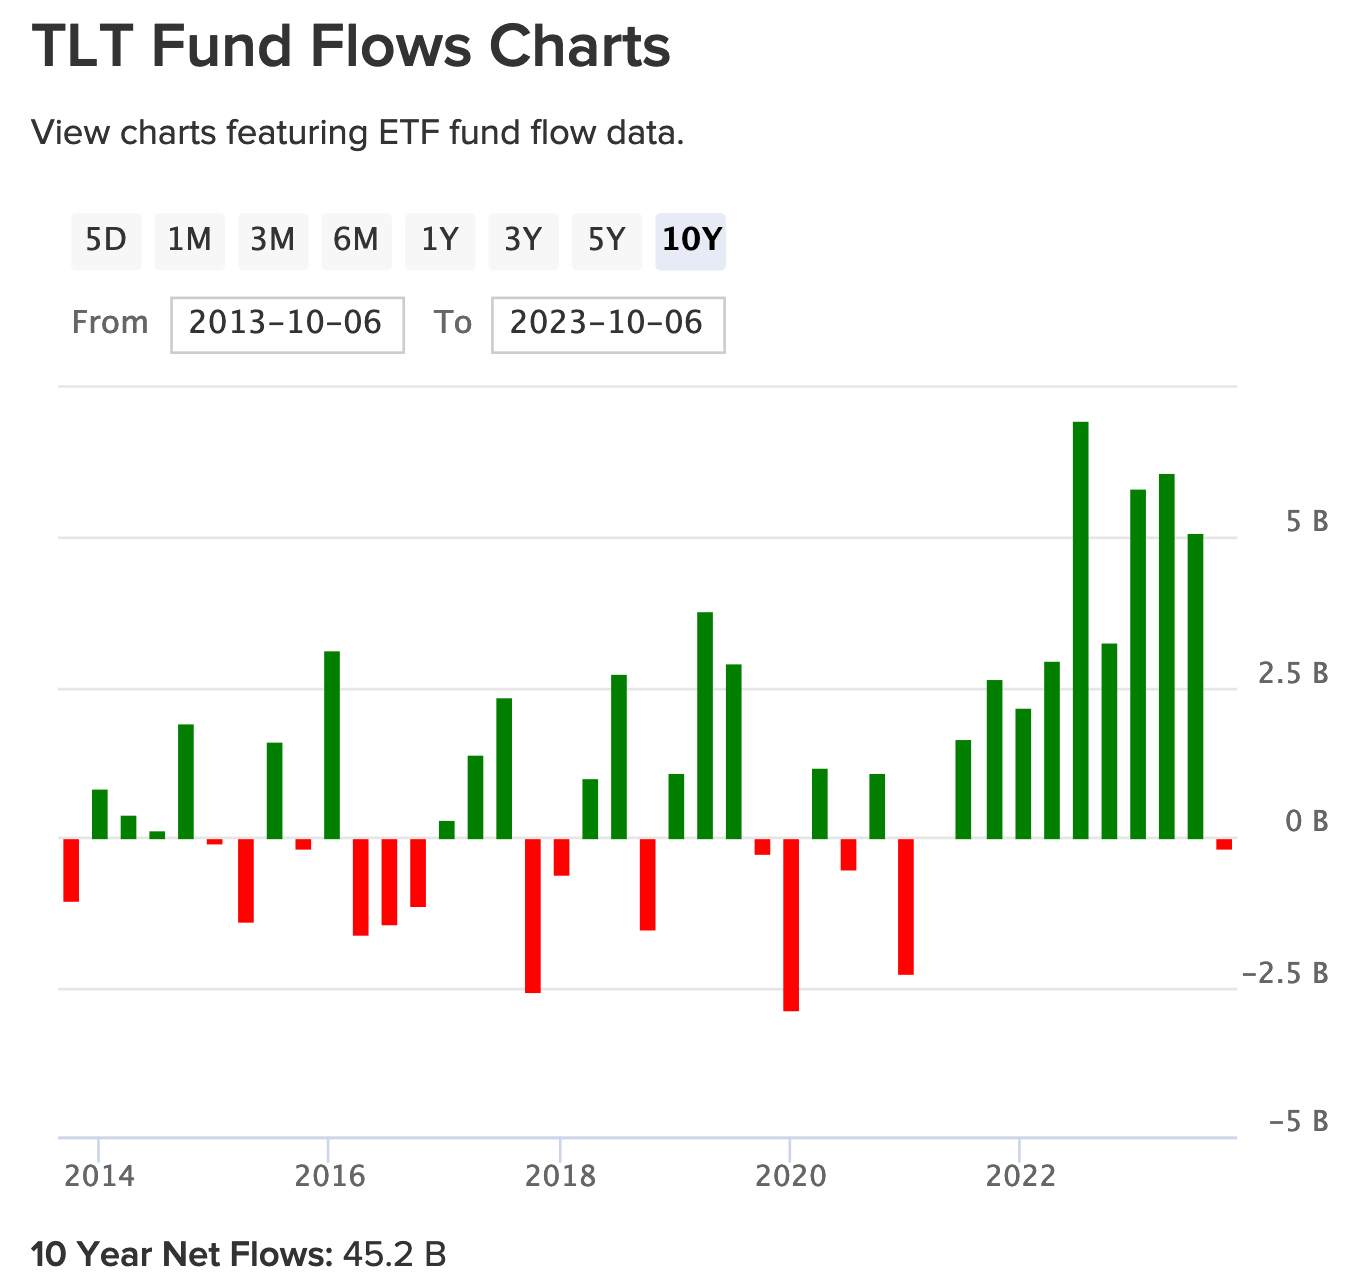
Significant Outflows from Treasury Funds
Just as in the sentiment chart, fund flows show that no one has changed their mind yet, that would mean some big red bars:
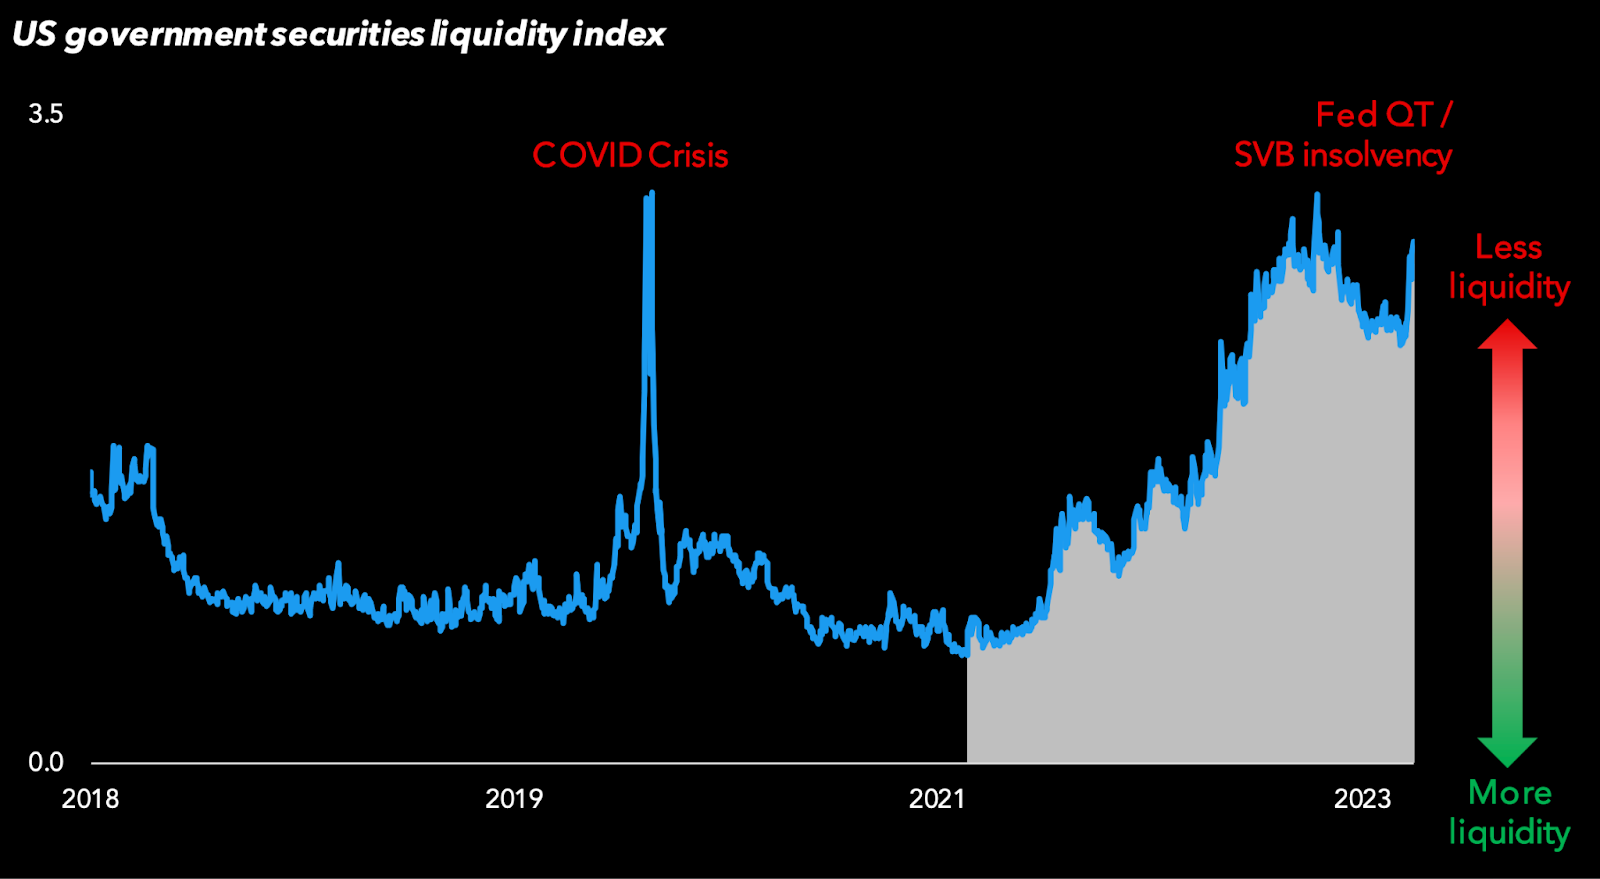
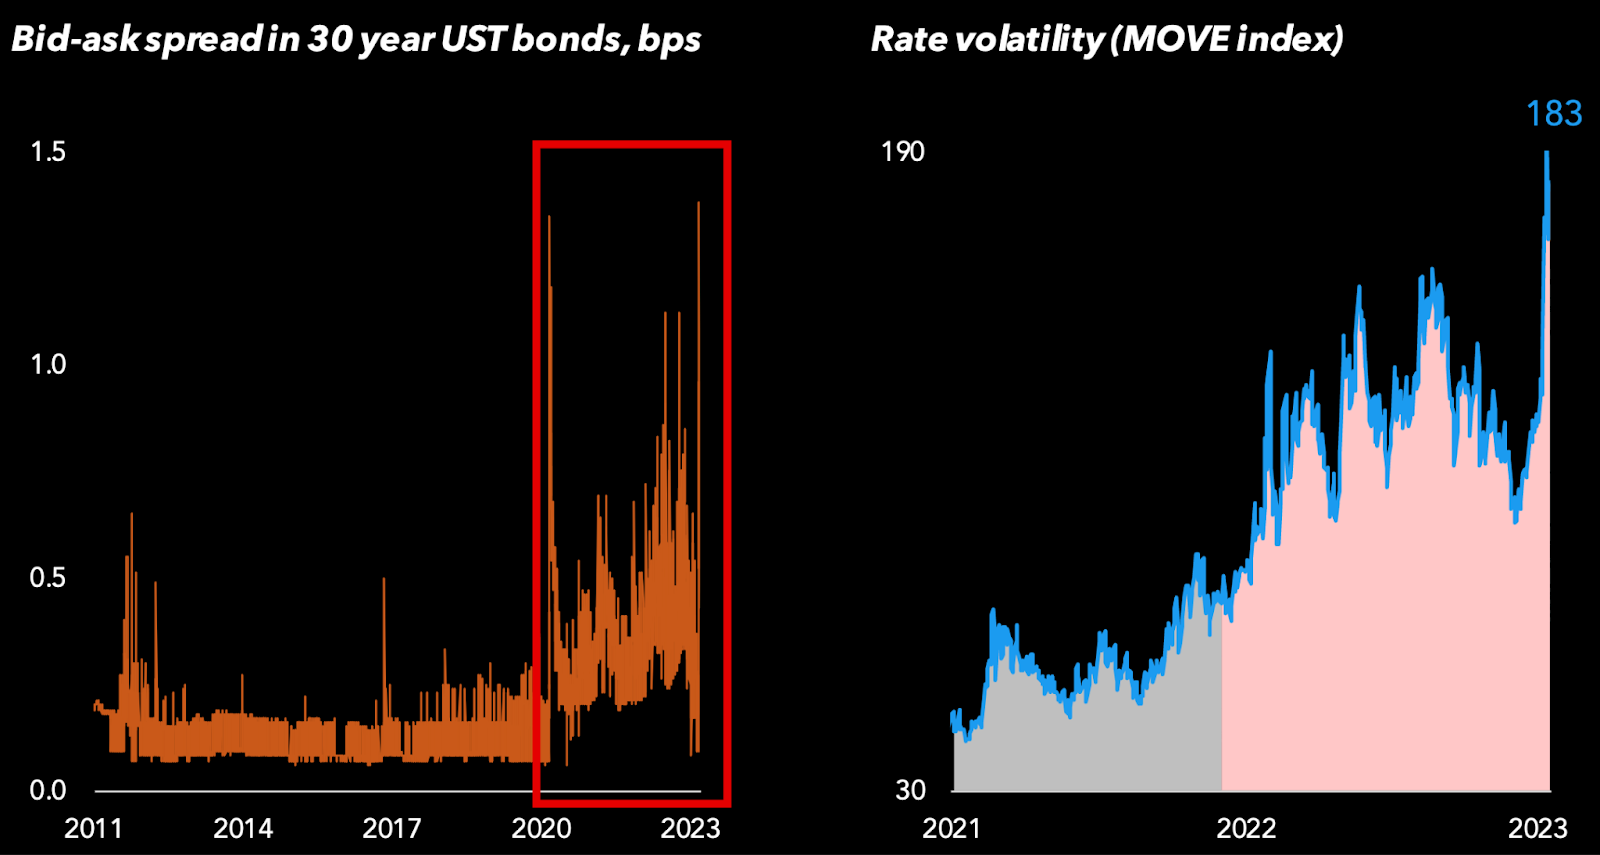
2. Liquidity
Liquidity drying up as buyers leave is a sign of a bottom, as shown widening bid-ask spreads.
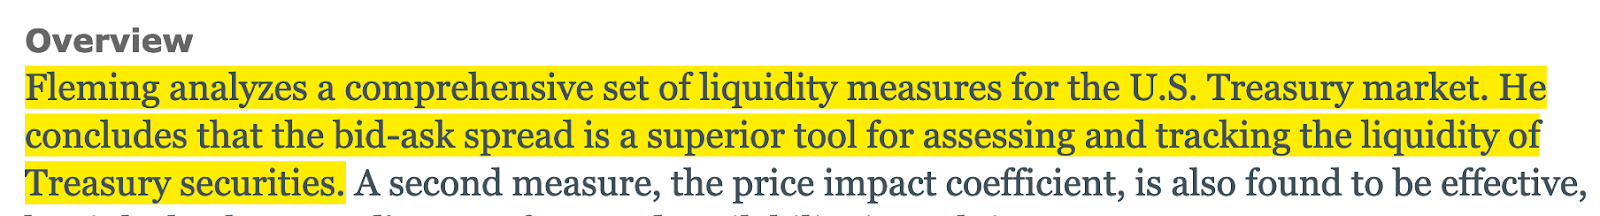
This one can get worse, but we can consider it checked at these levels. The supposedly endlessly liquid treasury market has already been exposed:
3. Key Technical and Psychological Levels
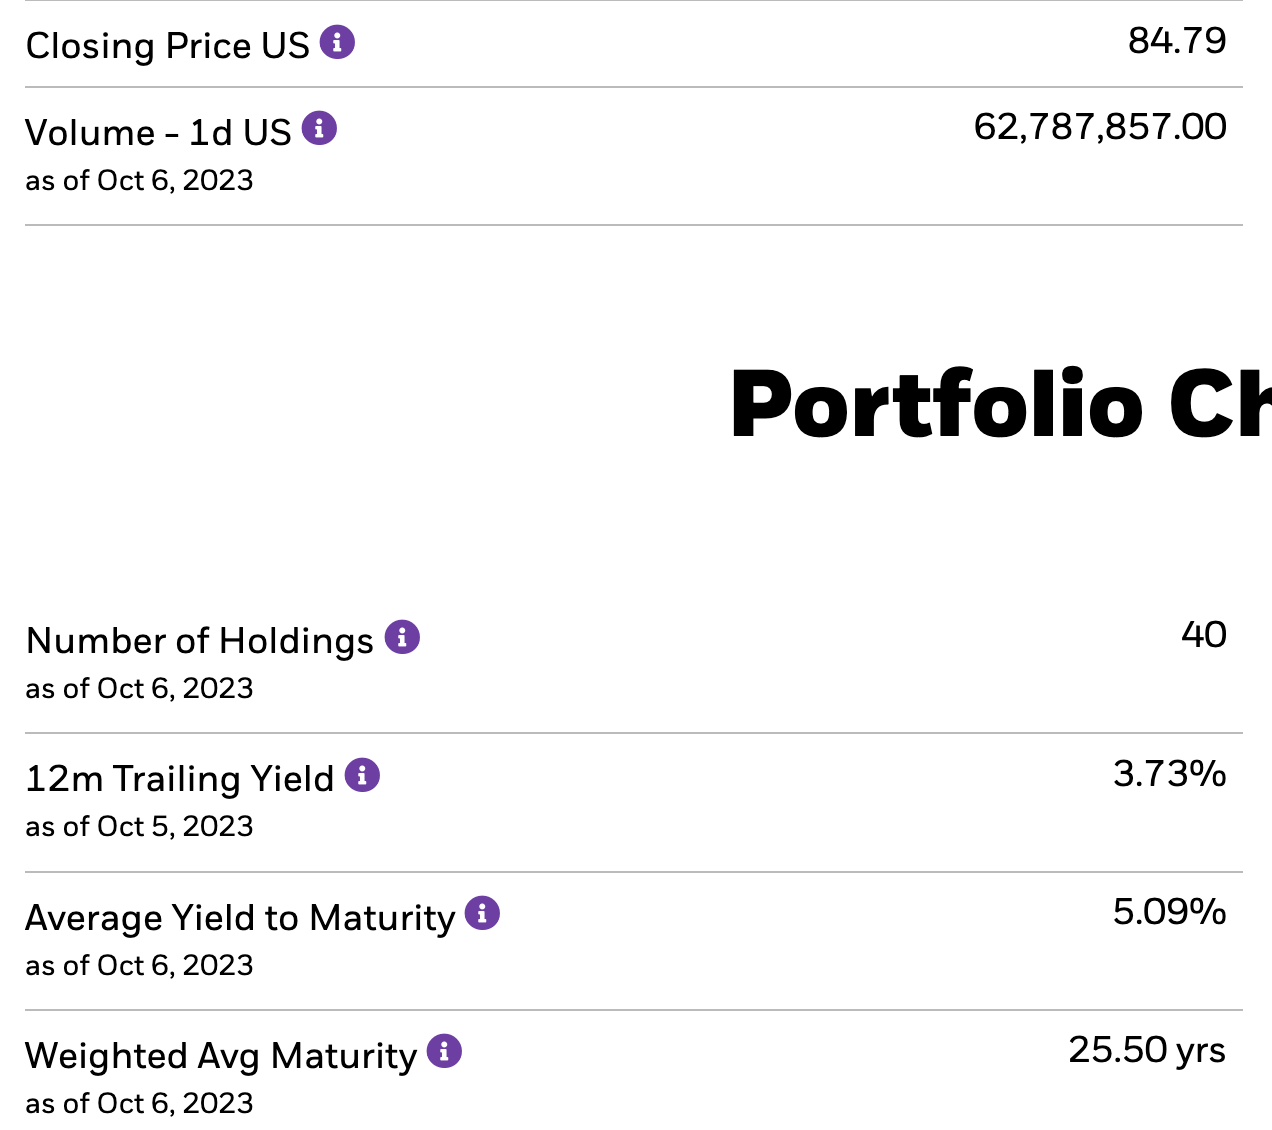
The $TLT has already broken right through prior support levels. $81 is a big test, next stop $64, then $58:
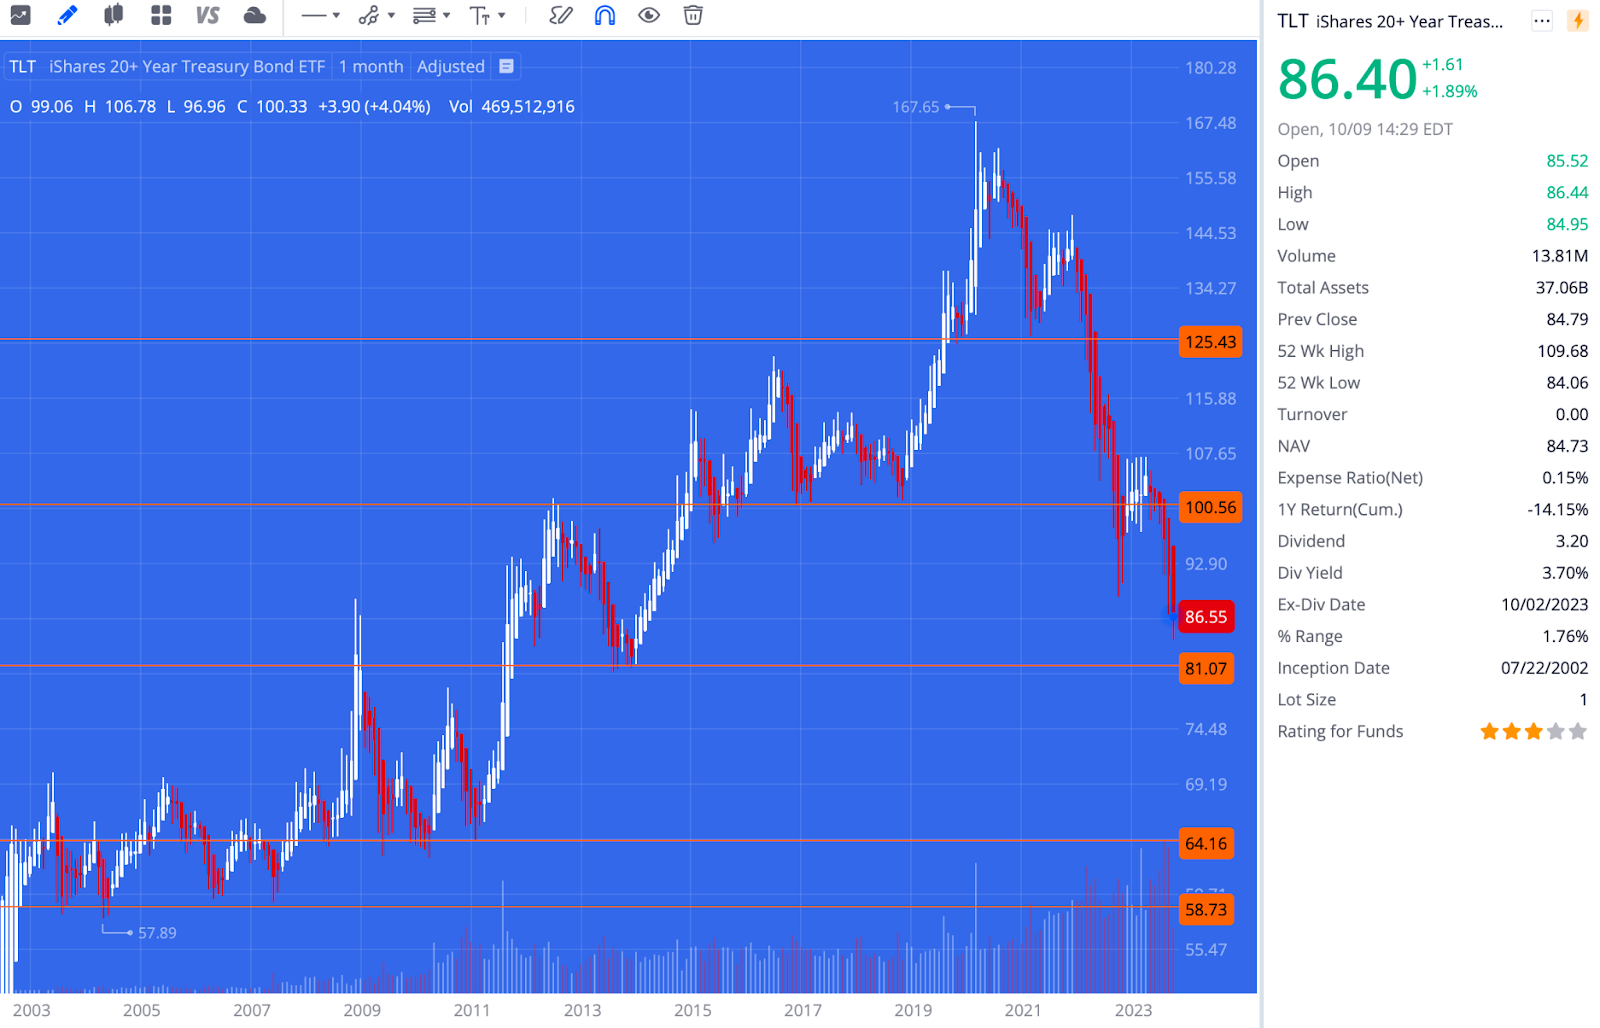
Economist @LukeGromen sees the Fed stepping in before $TLT hits $70. At that point TLT yields a virtual 6.2%.
Jamie Dimon says 7% is the worst case scenario. Presumably he means the popular 10 year rate:
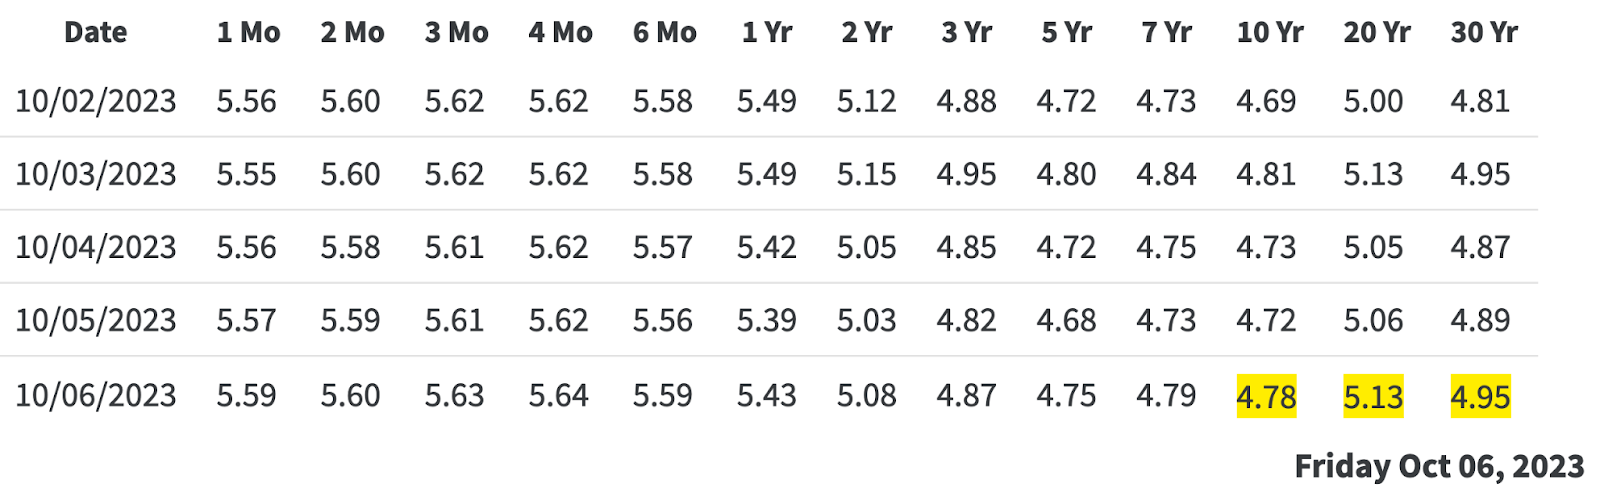
10 year Treasuries are currently priced at $47.97 with a yield of 4.804%. So $32.92 = 7% yield, a 31.4% drop for the 10 year.
If the $TLT drops 31.4%, it will be at $58.16 (right at its lowest support), with a virtual 7.4% yield.
These levels are arbitrary on one hand, but people are emotional and irrational and some of these key levels are likely to be big for market participants.
4. Volatility
Just like with liquidity, the key of volatility could get more dramatic, but it is already flashing its sign:
5. Non-Traditional Fed, Economic Data, and Global Events
We expect that the only thing that can slow this train is non-traditional Fed policy – buying up gobs of Treasuries to lower the government’s financing costs, trading economic pain for inflation pain.
When will that happen? We expect all of the above to come into play, along with economic data and global events.